Consider using Gantt charts if you’re looking for a solution to increase production. You can stay on time and fulfill deadlines using Gantt charts to track and manage projects. We’ll go through what Gantt charts are in this blog post and how you can utilize them to increase productivity. We’ll also offer some advice on how to design powerful Gantt charts.
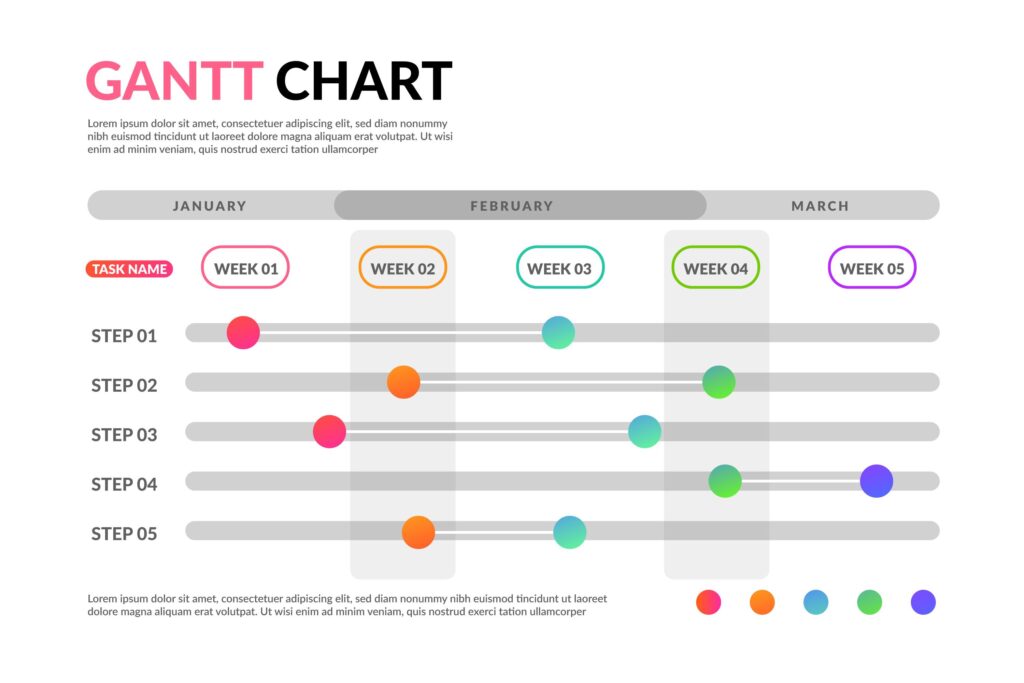
Gantt charts are particular bar charts showing a project’s timetable. Tasks are represented by bars in a Gantt chart; each bar’s length reflects the task’s duration. Gantt charts can be utilized for any size of the project, from little individual endeavors to significant business endeavors.
Using Gantt charts has several advantages. They can assist you with segmenting a project into smaller tasks and monitoring your development over time. This is particularly useful when working on a big or complicated project. Second, you can find possible hazards and bottlenecks using Gantt charts. Thirdly, they can aid in disseminating your project strategy to others.
Consider a few things to consider if you want to use Gantt charts to increase productivity. First, be sure to draft a project plan that is precise and explicit. Second, think about creating and managing your Gantt chart with software. Third, keep in mind that you should update your Gantt chart as your project develops. Using these suggestions, you’ll be on your way to creating a productive Gantt chart that can increase your output. So why are you still waiting? Start right away!
Creating a Gantt chart is simple and only requires a few steps:
- Determine the project’s end objective.
- Divide the goal into smaller jobs.
- Establish the length of each assignment.
- Make a bar chart with the tasks and their associated times.
Following the creation of your Gantt chart, you can start monitoring your progress and making adjustments as necessary. You’ll be well on your way to increasing your productivity if you keep in mind to update your Gantt chart as your project advances.
In the beginning, all Gantt Charts were drawn by hand on paper, which was inconvenient when the project needed to be altered. Later, this issue was solved when personal computers and software were developed. The old Gantt Charts have been entirely supplanted by desktop software and web-based tools for every project management team.
Why Are Gantt Charts Useful?
Why? Considering a Gantt chart is the perfect tool for project planning and scheduling, giving you information on who is responsible for what, when to start, and how long the task will take. Why? A Gantt chart is the best tool for organizing and scheduling projects since it clearly outlines who is responsible for each work, when to begin, and how long it will take to complete.
A Gantt chart also shows the links between related tasks and which tasks overlap with one another. Creating these graphics is simple for most individuals and requires little to no prior explanation or specialized experience. Once the diagram has been put together, everyone working on the project can easily understand what is happening.
Project monitoring calls for daily attention, team communication, and schedule modifications to keep your project on budget and ahead of time. A Gantt chart will make things considerably easier even though the project manager’s abilities account for most of this. Most programming systems let you easily edit tasks, dependencies, and milestones by dragging and dropping individual components to any desired location.
How to Create a Gantt Chart
You can make your own Gantt chart using either specialized project management software with a Gantt function or “good old” Microsoft Excel, while each has benefits and drawbacks. To help you choose the best tool for you, I’ll describe how to construct this chart using each method in the sections below.
- Make a list of all the things you have to do.
- Allocate each work to team members after estimating its duration.
- It is crucial to determine which activities must be accomplished and in what order before beginning any project, whether big or small, autonomous or collaborative.
The next stage is to identify the project’s “critical path,” which, contrary to popular belief, is simply the longest chain of interdependent tasks; these tasks indicate the minimum amount of time required to accomplish the project.
Creating a network diagram is the easiest way to determine the critical path. This can be done using a digital mind-mapping program or by connecting project activities and their durations on paper.
After identifying the project’s critical path, you can add tasks sequentially, one at a time. Include any independent or “floating” chores that can be accomplished whether or not other studies have been completed when you’re done. The key route should remain at the top, and the lower-level floating jobs should be clustered together. This will facilitate project monitoring and modification.

Excel or Dedicated Gantt Software?
When choosing a program to create charts, you have three options: Excel, standalone Gantt chart software, and project management software with a Gantt chart module. Excel’s versatility and strength make it feasible to produce Gantt charts. The ability to modify the chart is its most significant advantage when it is made in Excel.
Although Gantt chart software is specialized and typically less expensive, it lacks other project management tools like time tracking, resource management, or collaboration that may be required for your purposes. To meet such needs, you would require more apps.
Since it has all the tools you’ll need to manage your projects from start to end, project management software with integrated Gantt capability is a desirable option. Most modern platforms offer a user-friendly cloud interface at a low cost (ROI). Regardless of your choice, a Gantt chart is a crucial tool for managing medium to large projects and, in some circumstances (like construction projects), even smaller ones. See our TechnologyAdvice Guide to Project Management Software to learn about alternative project management options and features.
Understanding Gantt Charts
The most often used project management chart is the Gantt chart. These diagrams are helpful for project planning and specifying the sequence in which tasks must be accomplished. The bar is typically depicted as a horizontal bar graph. Horizontal bars of varying lengths that reflect the project’s chronology can include task sequences, durations, and start and end dates for each activity. The flat bar also displays the task completion percentage.
Project managers may ensure effective communication of the status and plans of their projects while also staying on schedule by using a Gantt chart. The chart manages goals and keeps track of particular activities and resources in a project by displaying the project timeline, which shows planned and finished work across time.
Benefits of a Gantt Chart
The chart shows which tasks can be completed concurrently and which cannot begin or finish until the others have been exhausted. It might help locate work left off the project schedule and pinpoint potential bottlenecks. The chart shows non-essential activities that can be delayed, critical activities that must be completed on schedule, slack task time, and additional time for task completion that shouldn’t wait for the project.
The progress of many projects, including constructing infrastructures like dams, bridges, and highways, can be monitored using Gantt charts. They may also involve technological endeavors like software development. Gantt charts can be made using project management tools like Microsoft Visio, Project, SharePoint, and Excel or specialized software like Gantto or Matchware.

How to use a Gantt chart?
Gantt charts show which tasks can be completed concurrently and which must be finished in order. It is possible to compare different scope outlines (doing more vs. less work), expenses (using more or fewer resources), and schedules for a project when we combine this data with how many people or resources a project needs. A project manager can then track the impact of adding extra resources or reducing the scope on the overall project’s completion date.
You must collect information on the tasks required to accomplish the project, how long each activity will take, and which jobs depend on others to create a chart. Organizing this data enables the project manager to concentrate on essential aspects of the project and create a work completion schedule.
In summary:
- Before making a Gantt chart, list every task for the project and break it down into more manageable chunks.
- After that, assign responsibilities to the team and designate who will be in charge of each task.
- Determine each activity’s completion dates, including the total project duration and subtask duration. Identify task linkages. A Gantt chart can indicate task dependencies and tasks in chronological order (i.e., how one job depends on another).
- Make a decision and distribute your resources.
You can make a backup plan to deal with future problems by anticipating risks and concerns you might encounter.
What is a Gantt chart used for?
Project managers use Gantt charts for three primary purposes:
-Build and manage a comprehensive project
Gantt charts make it easier to identify the crucial project milestones, divide the project into more manageable tasks, and arrange those activities according to a timeline. Dependencies between tasks, assignees, and milestones can also be added to the chart.
-Determine logistics and task dependencies
Gantt charts help track and manage a project’s logistics. Because of task dependencies, new tasks can only start once existing ones have been completed. If a job is postponed, dependent problems are automatically rescheduled (which does happen to the best of us). This might be quite helpful when making plans for a multi-team scenario.
-Monitor the progress of a project
As teams complete tasks from your plan, you can maintain tabs on the progress of your projects by checking in on their status. Release dates, milestones, or other crucial indicators may be included in your Gantt chart to track the development of your project.

Why Is a Gantt Chart Important?
A Gantt chart is a flowchart that shows how one or more project activities are carried out. These timelines show the connections between the various tasks. Gantt charts are helpful since they summarize a project’s activities and development.
Gantt charts demonstrate how work on a particular task can only start if a related activity has been finished. Project managers can better understand project challenges and make important decisions about how to proceed with a project using such data.
The Advantages of Gantt Charts
Managers and employees are given a high-level overview of the project tasks they must complete and a timeline to complete their work using a Gantt chart. The graph lets you keep track of the project’s development by illustrating how jobs link to one another.
-The Main Benefits of Gantt Charts
The fact that Gantt charts give a thorough overview of a project is a major benefit of using them. Tasks are organized chronologically in Gantt charts, which avoid surprises, help employees and supervisors remain on top of their responsibilities, and make it simpler for managers to allocate resources effectively and guarantee that projects are finished on time.
Here are some of the main benefits of Gantt charts:
- It Provides a High-Level Overview: For those who are extensively involved in a project and those who are less involved, such as executives and other stakeholders, a Gantt chart provides an overall picture of the status and timeframe of the project.
- A Gantt chart has a pleasing visual appearance and is simple to understand. It gives essential task details, such as the sequence in which they start and how long they will last, in a single glance.
- A Gantt chart may help managers and staff members manage their time and resources successfully. It increases efficiency and aids in resource management. Project managers can use it to make realistic timelines and allocate resources aligned with those plans, such as giving the right personnel to the right tasks. It can also help team members devise solutions for potential problems before a project starts.
- Better Tracking is Possible: Project managers and team members can utilize Gantt charts to track progress, identify potential problems, and make adjustments.
- A Gantt chart demonstrates dependencies and overlaps between jobs in a project. Additionally, it illustrates how the start of one job depends on its completion. With this information, project managers may schedule labor and resources so they don’t impede the project’s development.
- It Increases Production: The Gantt chart encourages teamwork and increases productivity. Because of the excellent visibility a Gantt chart provides, people can maintain their attention on the tasks at hand. This visibility also ensures that each team member is accountable for their duties.
- It Allows You to Balance Multiple Projects: Managers can track numerous projects using a Gantt chart. The chart then enables those executives to evenly distribute the workload across each project because it illustrates when to provide the right resources.
- Gantt charts provide visual clarity for complex activities, displaying them clearly and straightforwardly for people who must perform the work. This makes complex information manageable. Team members may maintain concentration and avoid feeling overburdened by numerous responsibilities at once, thanks to transparency like this.
- Gantt charts are a beneficial tool for project management since they list all the actions that must be carried out to conclude a project, which helps you set realistic deadlines and expectations. They show not only the connections and interdependencies between those jobs but also give an accurate idea of how long each activity will take. Setting realistic timeframes for individual actions and the entire project depends on this correct information.
- It Aids in Maintaining Alignment Among Team Members, Including Remote Employees: When a project team’s members, including remote workers and those working from distant places, have simple access to the same information, everything remains on schedule. The diagram encourages improved teamwork and communication among all participants.
- A Gantt chart helps team members see their responsibilities in-depth, inspiring them to complete the task. Team members can monitor the project’s development and see other team members finish their assignments. The graphic also illustrates how some tasks must be finished before others. Because of all this knowledge, people can complete their work accurately and on time.
The Disadvantages of Gantt Charts
Gantt charts can be problematic. It can take some time to set them up, and the chart may become confusing and challenging if you’re working on a big project with lots of tasks.
-The Main Challenges of Gantt Charts
Gantt charts can have issues. Setting them up can take time, and the chart might become difficult to grasp if you’re working on a large project with many tasks.
Here are some of the main challenges of Gantt charts:
- A Gantt chart is a frequently used tool for planning and monitoring the progress of complicated projects, but setup might take some time. Although setting one up might be difficult and time-consuming, software programs can help.
- Gantt charts for complicated projects can become incredibly intricate. They can also become complex and confusing. Every adjustment to the timetable will have an impact on every component of the chart, which might be challenging to handle manually.
- Because it simplifies information and lets you view the entire project at once, a Gantt chart is an invaluable tool for project managers. However, the diagram becomes less effective when there are hundreds of activities to be completed.
- Gantt charts illustrate the tasks required to complete a project in order, but they do not indicate which tasks are the most crucial. Without this knowledge, team members might not know the importance of particular goals.
- They Don’t Provide Much Detail About Task Dependencies: Gantt charts help show the order in which tasks must be finished for a project. They are less valuable when attempting to comprehend all of the various dependencies within a single charge.
- In other words, a Gantt chart might not contain all the data required to determine whether it is effective. As a result, a project team may want to use a Gantt chart and a program evaluation review approach (PERT) chart. Arrows on the PERT chart or graphic show the sequence in which project team members must finish particular tasks before moving on to the next job.
- The length of a Gantt chart taskbar represents how long it will take to accomplish a task, but it does not show how much work each job requires. This length does not, however, specify the resources needed for such a project.
- Some tasks may demand a lot of work if they have short bars (which indicate short deadlines). Some long-bar exercises could just require a small amount of input. The Gantt chart may not accurately represent the amount of time and materials you’ll need. As a result, you might want to use other tools besides the Ganttheadendc to assign and track resources effectively.

Gantt Charts and Critical Path Analysis
Both Gantt charts and the critical path methodology are crucial project management tools. They enable you to keep an eye on a project’s development and manage related tasks so that it completes on time and within budget. Gantt charts can be used to monitor functions about a deadline.
On the other hand, critical routes depict the sequence of project activities that show how long a project will take and present essential deadlines you must follow to conclude a project on schedule. Therefore, the critical path is essentially the period between the start of a project and its completion.
When used in conjunction with the critical path approach, a Gantt chart enables you to precisely track the development and scheduling of your project and provide a timeline for the project’s tasks. Your Gantt Chart monitors these scheduled things while your critical path analysis helps you make better scheduling judgments and estimations.
You can alter your project schedule as it develops and gain a precise understanding of how each task grows when you have flexibility in monitoring the critical path on a timeline, such as with a visual Gantt chart.
What Is a Critical Path in a Gantt Chart?
When one activity slows down a connected series of tasks, delaying the project’s completion date overall, this is referred to in a Gantt chart as the critical path.
By calculating how much a task extends the project’s duration, you may assess if it is on the critical path. When determining if a job is non-critical, consider how crucial it is to the success of your project. It is non-critical if it is not necessary. By eliminating any non-critical channels from your project, you might be able to save time and money.
The critical route approach calculates the shortest time required to complete each task. In addition, some jobs may have tiny leeway and must meet deadlines. After manually calculating your critical route, you can perform further calculations using project management software.
Conclusion
Gantt charts could be the solution for increasing productivity if that’s what you’re after. You can stay on time and fulfill deadlines using Gantt charts to track and manage projects. This blog post has covered all there is to know about Gantt charts. Additionally, we have offered some advice on how to design efficient Gantt charts. So why are you still waiting? Start utilizing Gantt charts right away to increase your output!